Posts

Quartile,Deciles And Percentiles

Image
  Today    we will see some important measures of central tendency called Quartile,Deciles and Percentiles... 1)Quartile Three variate  value of the variables which divides the series(data) into four equal parts are called Quartiles. There  are three quartiles namely Q1,Q2 and Q3.Q1 is known as lower or first quartile,Q2 is  the second quartile (median) and last one Q3 is known as upper or third quartile.25% values are less then Q1 and 25% values are larger than Q3 and the rest 50% values lie between Q1 and Q3.And Q2 devides data into two equal parts and due to this this is also known as median.The quartiles can help us to find some insights of given data set.These widely used in data analytics and economics.By these values we can about shape of distribution. 2)Deciles The variate value of the variables which divides the series(data) into ten equal parts are known as Deciles.They are denoted by D1,D2....so on.fifth decile divides data into two parts so it i...
Measures of skewness

Image
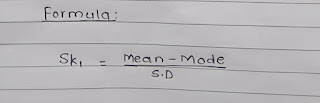
  As we described the importance and use of skewness in last post,Now  we are going to see the different formula's derived famous mathematicians and statistician.These measures are easy to calculate and have commenting capacity.We will see two methods elucidated by karl pearson and prof. Bowley. I) Pearson's coefficient of Skewness     Karl Pearson developed two methods for finding skewness in sample,by using mode and second one is by median 1) Pearson's coefficient of skewness using mode- Interpretation of calculation done by using formula If Sk<0 - negatively skewed If Sk=0 - symmetric If Sk>0 - positively skewed. Let us consider following example  A sample with mean 15 ,mode 14 and standard deviation 2.. Sk=(15-14)/2=1/2=0.5 Sk>0 . Hence the curve of given sample is positively skewed  2) Pearson's coefficient of skewness using median: Example: A sample with mean 20 ,median 22 and standard deviation 3. Sk=3×((20-22)/3)=-6/3=-2 Here Sk...

Median for continuous data

Image
  Median for continuous data As we said in  previous post,We will come with post to find median for continuous data.we seen median for discrete data series. Now,median for grouped data.let us take the following data. 1) When classes are continuous Where , L=lower limit of median class f=frequency of median class N=total frequency c.f=cumulative frequency of previous class to median class i=class interval Here N=39  N/2=39/2=19.5 Hence cumulative frequency just greater than 19.5 is 24. Therefore 20-30 is median class. Here L=20,N=39,c.f=12,i=10-0=0,f= 12. Median=20+(((39/2)-12)/12)×10) Median=26.5 II)When classes are inclusive First we will convert classes into continuous type.... For that we will find: (11-10)/2=1/2=0.5           Add 0.5 to upper limit and and           Subtract 0.5 from lower limit. New table: Here N=39            N/2=39/2=19.5 Hence cumulative frequency j...

Skewness

Image
  What is Skewness? Skewness is asymmetry (lack of symmetry) in a statistical distribution, in which the curve appears distorted or skewed either to the left or to the right. Skewness can be quantified to define the extent to which a distribution differs from a normal distribution. In a normal distribution, the graph appears as a classical, symmetrical "bell-shaped curve." The mean, or average, and the mode, or maximum point on the curve, are equal. In a perfect normal distribution, the tails on either side of the curve are exact mirror images of each other. When a distribution is skewed to the left, the tail on the curve's left-hand side is longer than the tail on the right-hand side, and the mean is less than the mode. This situation is also called negative skewness. When a distribution is skewed to the right, the tail on the curve's right-hand side is longer than the tail on the left-hand side, and the mean is greater than the mode. This situation is also cal...

Variance and standard deviation

Image
  variance and standard deviation In  statistics we come across some words which are used in so many situations and one of them are variance and standard deviation... Variance  The variance can be defined as the average of squared differences from mean value.In rough terms it is measure of how far set of data(numbers) are spread out from their mean (average) value.Variance never be negative.By variance we can draw some useful insights for given data.For comparison purpose variance can be useful in many cases. variance is very useful in lot of statistical measures,test,analysis and many more... Standard deviation Standard deviation measures how spread out the values in a data set are around the mean. More precisely, it is a measure of the average distance between the values of the data in the set and the mean. If the data values are all similar, then the standard deviation will be low (closer to zero). If the data values are highly variable, then the standard variation is ...

Median

Image
  Median Median is the value of the variable that divides the ordered set of values into two equal parts. In another words,median is the middle most value of ordered( ascending or descending)set of values.50% of values are to the left side of the median and 50% values are on right side of the median. let us consider there are N values in the data set. I)when N is odd,then  Median=size of(N+1/2) th item(Arranging values in ascending or descending order) Example:  values =1,2,3,4,5 here,Median is 3 II) when N is even , median is the average of size of (N/2)th item and (N+2/2) th item. Example: Heights (in cm) = {180, 167, 154, 122, 181, 135, 123, 145, 166, 145} Rearranged Heights= {122, 123, 135, 145, 145, 154, 166, 167, 180, 181} Median = (145+154)/2 = 149.5= 149.5 Median is preferable measure of location for asymmetric distribution.Median is best measure of central tendency as it is least affected by extreme values.Median can be visually located for discrete values....

Types of Mean - AM,GM and HM

Image
  In  this post we will see different types of mean ,their interrelation with each other and their interpretation... Mean is of mainly  three different types the first one is arithmetic mean (AM),second one is geometric mean(GM) and  third one is harmonic mean(HM). First we will see about the arithmetic mean. Arithmetic mean (AM)     In mathematics and statistics, the arithmetic mean is nothing but mean,is the sum of collection of number divided by the count of numbers in collection.. Let us take an example,the set of values is 10,20,30  The arithmetic mean is 20. This mean is mostly used to get rough idea or overview about data set. Geometric mean(GM) Geometric mean is type of average and is defined as"the n'th root of product of n numbers" Geometric mean for 10,20,30 is 18.1712 Most important use of geometric mean is usually used in for growth rates like population growth rate. Harmonic mean Harmonic mean is the reciprocal of the average of reciproca...